
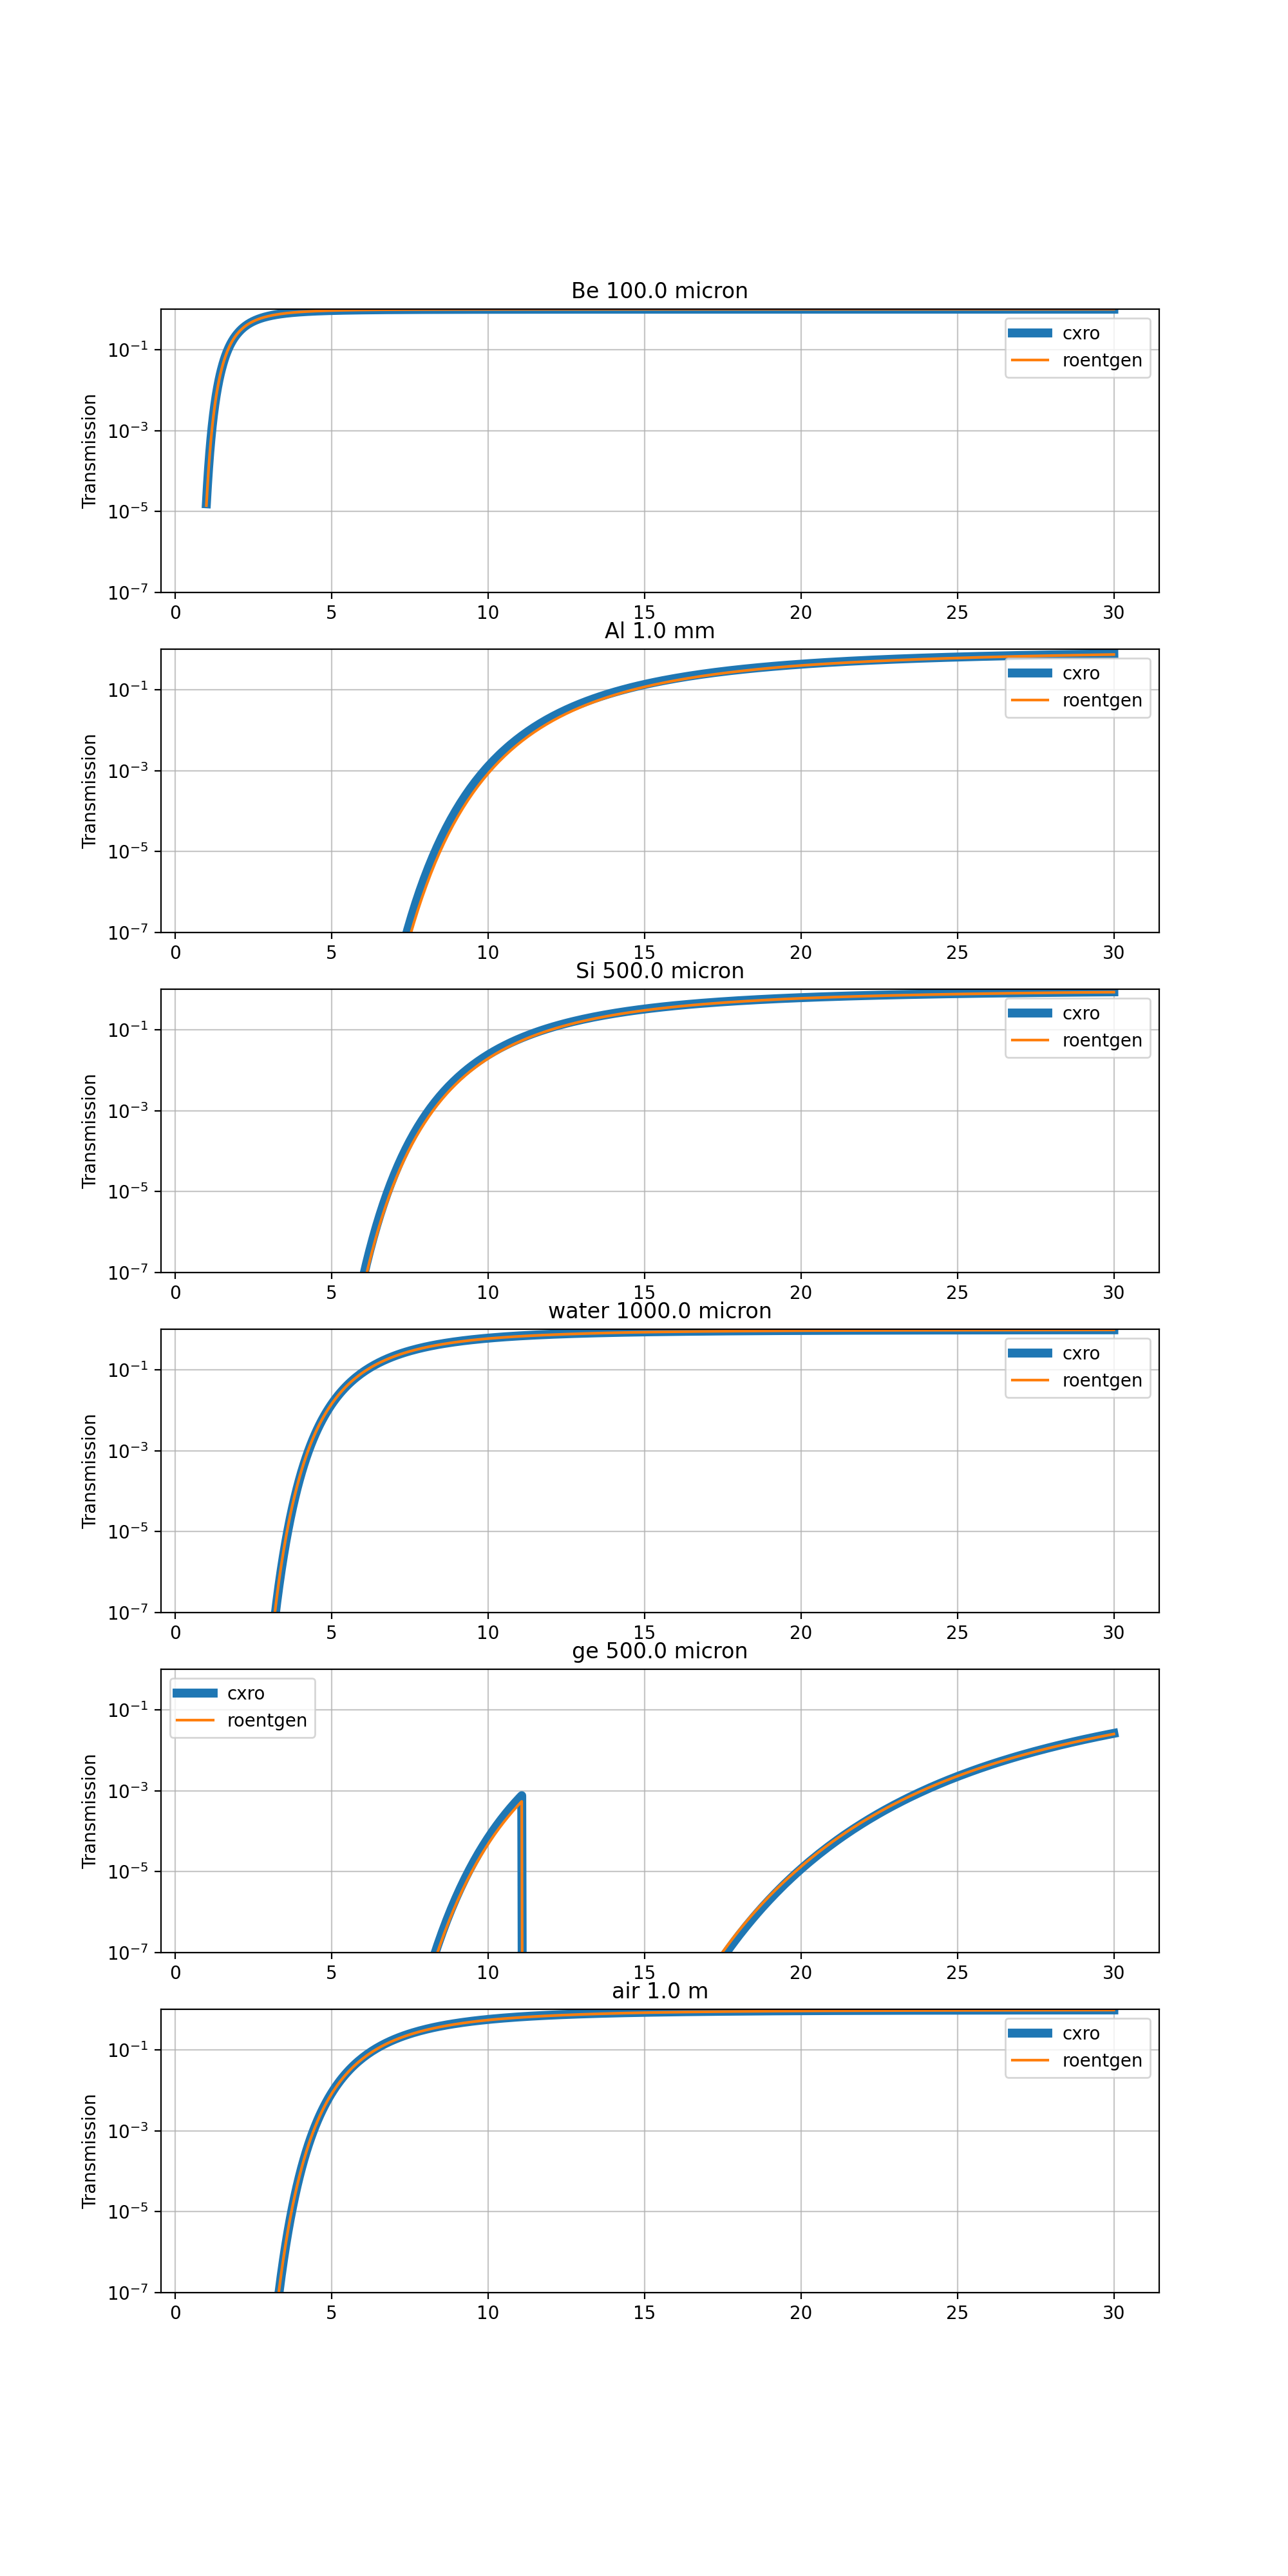
Comparison with CXRO#
The Center for X-ray Optics (CXRO) at LBL provides an online tool to calculate the X-ray transmission through materials called the X-ray Interactions with Matter. This section compares the results of this package with those of CXRO. The primary difference between results from this package and those from CXRO are that we make use of the NIST-provided Mass Attenuation coefficients while the CXRO makes use of optical constants from the following
These data only extend up to 30 keV while the NIST-provided data extend to 20 MeV. For more information on data sources see the README in the data directory. The comparison here shows that the data agree with each other.
from pathlib import Path
import matplotlib.pyplot as plt

import numpy as np
from astropy.io import ascii
from astropy.table import Table
import astropy.units as u
from astropy.constants import atm

import roentgen
from roentgen.absorption import Material
from roentgen.util import density_ideal_gas

cxro_filenames = ('be_100micron.dat', 'al_1mm.dat', 'si_500micron.dat',
                  'water_1000micron.dat', 'ge_500micron.dat',
                  'air_1m_1atm_295kelvin.dat')

cxro_files = [roentgen._data_directory / 'cxro' / f for f in
              cxro_filenames]

material_list = ['Be', 'Al', 'Si', 'water', 'ge', 'air']
thick_list = [100 * u.micron, 1 * u.mm, 500 * u.micron, 1000 * u.micron, 500 * u.micron, 1 * u.m]

def trans_plot(ax, x, a, b):
    ax.plot(x, a, label='cxro', linewidth=5)
    ax.plot(x, b, label='roentgen')

    ax.grid(which='major', alpha=0.7)
    ax.grid(which='minor', alpha=0.2)
    ax.set_yscale('log')
    ax.set_ylim(1e-7, 1)
    ax.legend()

fig, axis = plt.subplots(len(material_list), figsize=(10, 20))

for ax, this_material, this_thickness, this_file in zip(axis, material_list, thick_list, cxro_files):

    cxro_data = ascii.read(str(this_file), data_start=2, fast_reader=False, format='basic', header_start=2, names=['energy', 'transmission'])
    if this_material == 'air':
        density = density_ideal_gas(atm, 295 * u.Kelvin)
        mat = Material(this_material, thickness=this_thickness, density=density)
    else:
        mat = Material(this_material, thickness=this_thickness)
    transmission = mat.transmission(u.Quantity(cxro_data['energy'], 'eV'))
    print(f'{this_material} {mat.density}')
    trans_plot(ax, cxro_data['energy']/1000, cxro_data['transmission'], transmission)
    ax.set_title(f'{this_material} {this_thickness}')
    ax.set_ylabel('Transmission')

plt.show()
(Source code, png, hires.png, pdf)
