
Edges in the Mass Attenuation Coefficient and Interpolation#
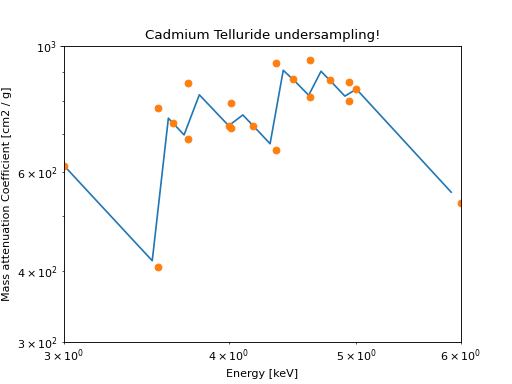
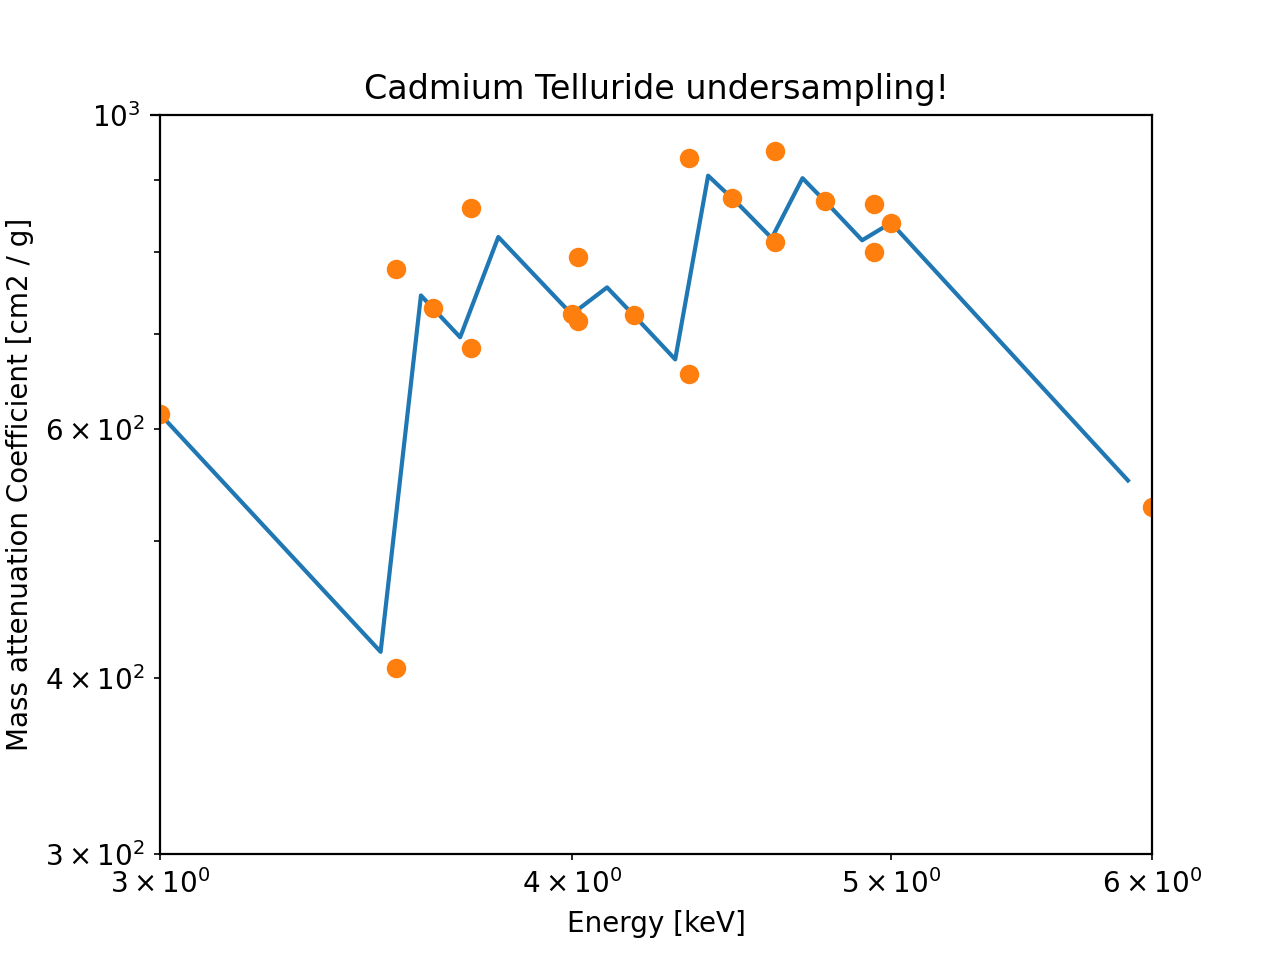
Some elements have complex features in their mass attentuation coefficients. The mass attenuation coefficients are interpolated between data points so be careful to include sufficient points to resolve those features if you are looking for high accuracy.
import numpy as np
import matplotlib.pyplot as plt

import astropy.units as u
from astropy.visualization import quantity_support
quantity_support()
from roentgen.absorption import MassAttenuationCoefficient

cdte_atten = MassAttenuationCoefficient('cdte')

energy = u.Quantity(np.arange(3, 6, 0.1), 'keV')
atten = cdte_atten.func(energy)

plt.plot(energy, atten)
plt.plot(cdte_atten.energy, cdte_atten.data, 'o')
plt.yscale('log')
plt.xscale('log')
plt.ylim(300, 1000)
plt.xlim(3, 6)
plt.xlabel('Energy [' + str(energy.unit) + ']')
plt.ylabel('Mass attenuation Coefficient [' + str(atten.unit) + ']')
plt.title(cdte_atten.name + ' undersampling!')
plt.show()
(Source code, png, hires.png, pdf)

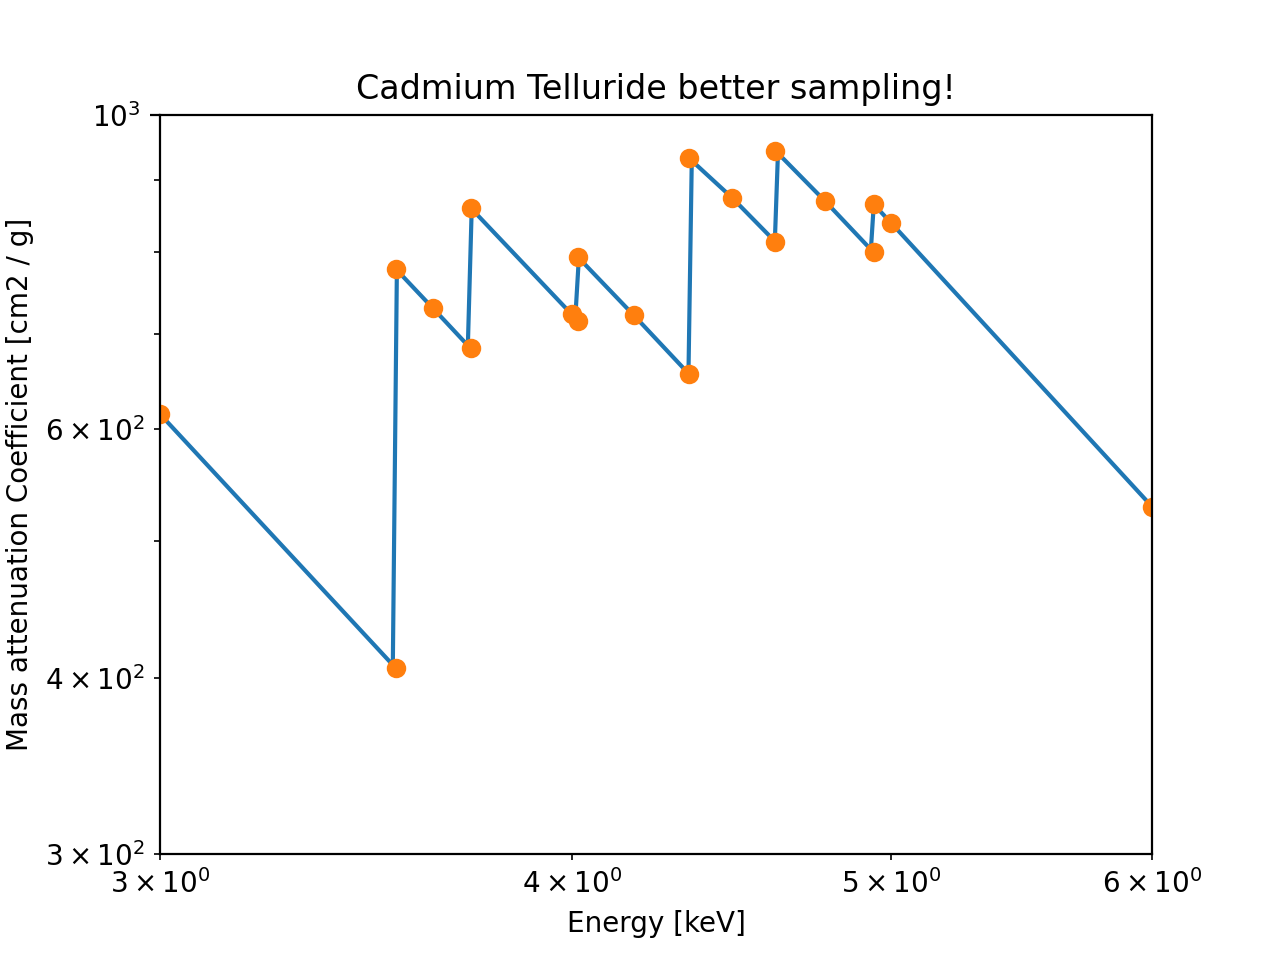
The above example is clearly undersampled. Let’s add better sampling.
import numpy as np
import matplotlib.pyplot as plt

import astropy.units as u
from astropy.visualization import quantity_support
quantity_support()
from roentgen.absorption import MassAttenuationCoefficient

cdte_atten = MassAttenuationCoefficient('cdte')

energy = u.Quantity(np.arange(3, 6, 0.01), 'keV')
atten = cdte_atten.func(energy)

plt.plot(energy, atten)
plt.plot(cdte_atten.energy, cdte_atten.data, 'o')
plt.yscale('log')
plt.xscale('log')
plt.ylim(300, 1000)
plt.xlim(3, 6)
plt.xlabel('Energy [' + str(energy.unit) + ']')
plt.ylabel('Mass attenuation Coefficient [' + str(atten.unit) + ']')
plt.title(cdte_atten.name + ' better sampling!')
plt.show()
(Source code, png, hires.png, pdf)
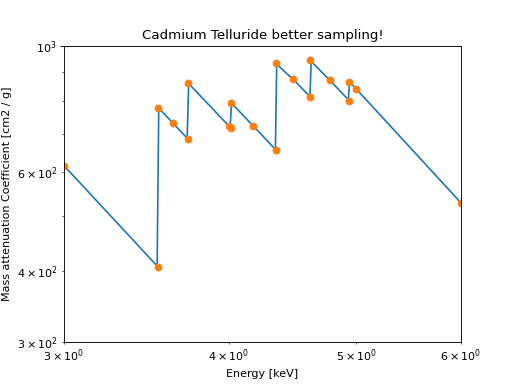
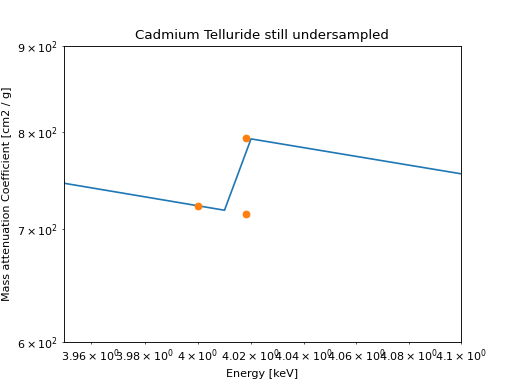
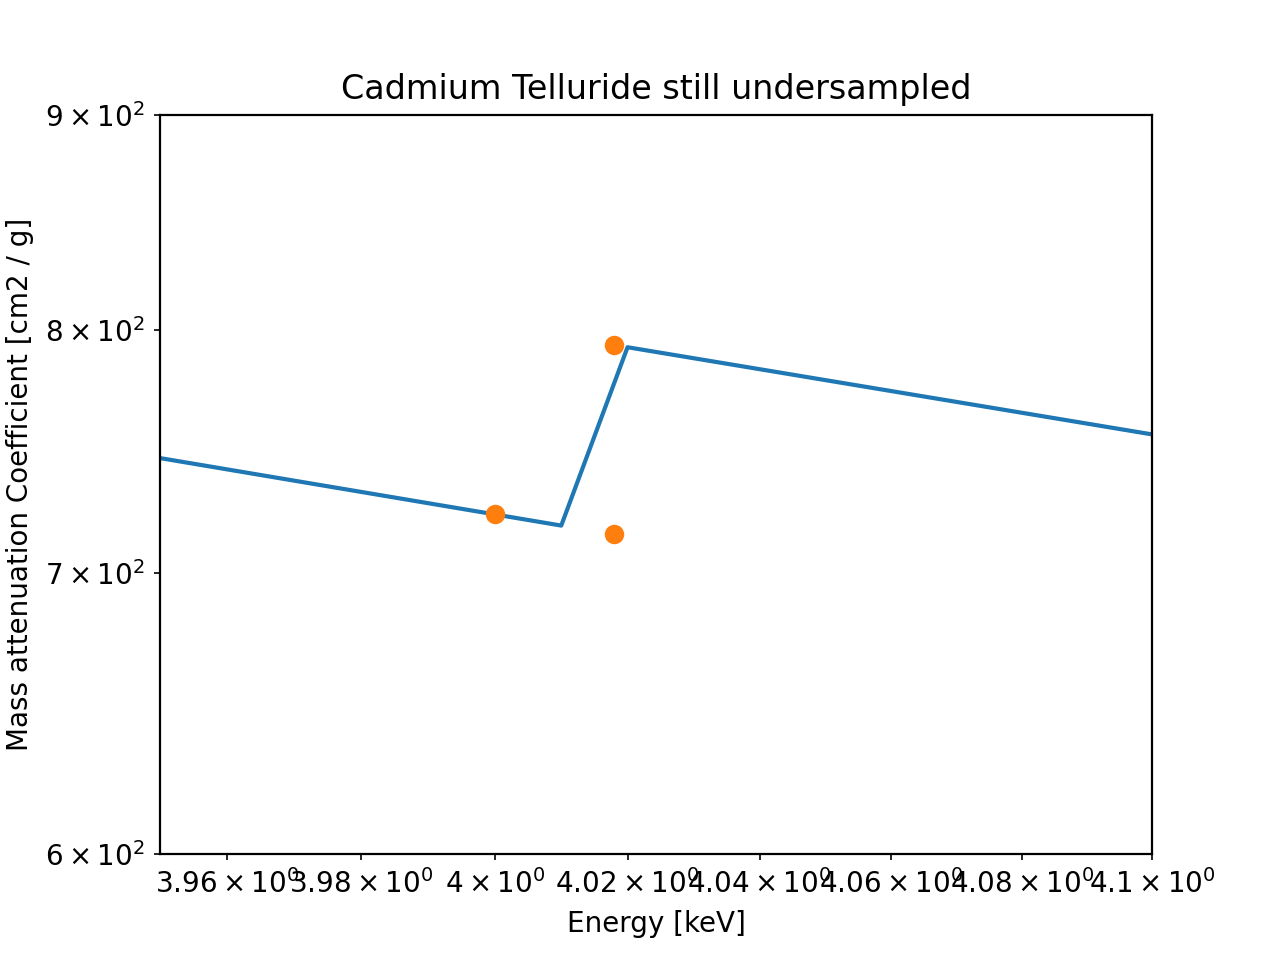
This looks much better! Though if we look very closely, we see that we are still undersampling.
import numpy as np
import matplotlib.pyplot as plt

import astropy.units as u
from astropy.visualization import quantity_support
quantity_support()
from roentgen.absorption import MassAttenuationCoefficient

cdte_atten = MassAttenuationCoefficient('cdte')

energy = u.Quantity(np.arange(3, 6, 0.01), 'keV')
atten = cdte_atten.func(energy)

plt.plot(energy, atten)
plt.plot(cdte_atten.energy, cdte_atten.data, 'o')
plt.yscale('log')
plt.xscale('log')
plt.ylim(600, 900)
plt.xlim(3.95, 4.1)
plt.xlabel('Energy [' + str(energy.unit) + ']')
plt.ylabel('Mass attenuation Coefficient [' + str(atten.unit) + ']')
plt.title(cdte_atten.name + ' still undersampled')
plt.show()
(Source code, png, hires.png, pdf)

For many calculations, this small difference may not matter.