Plotting the x-ray spectrum from a particular element#
import numpy as np
import matplotlib.pyplot as plt
from astropy.visualization import quantity_support
import astropy.units as u
from astropy.modeling.models import Lorentz1D
quantity_support()
from roentgen.lines import get_lines
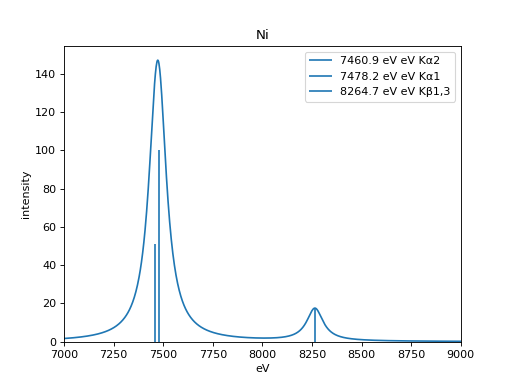
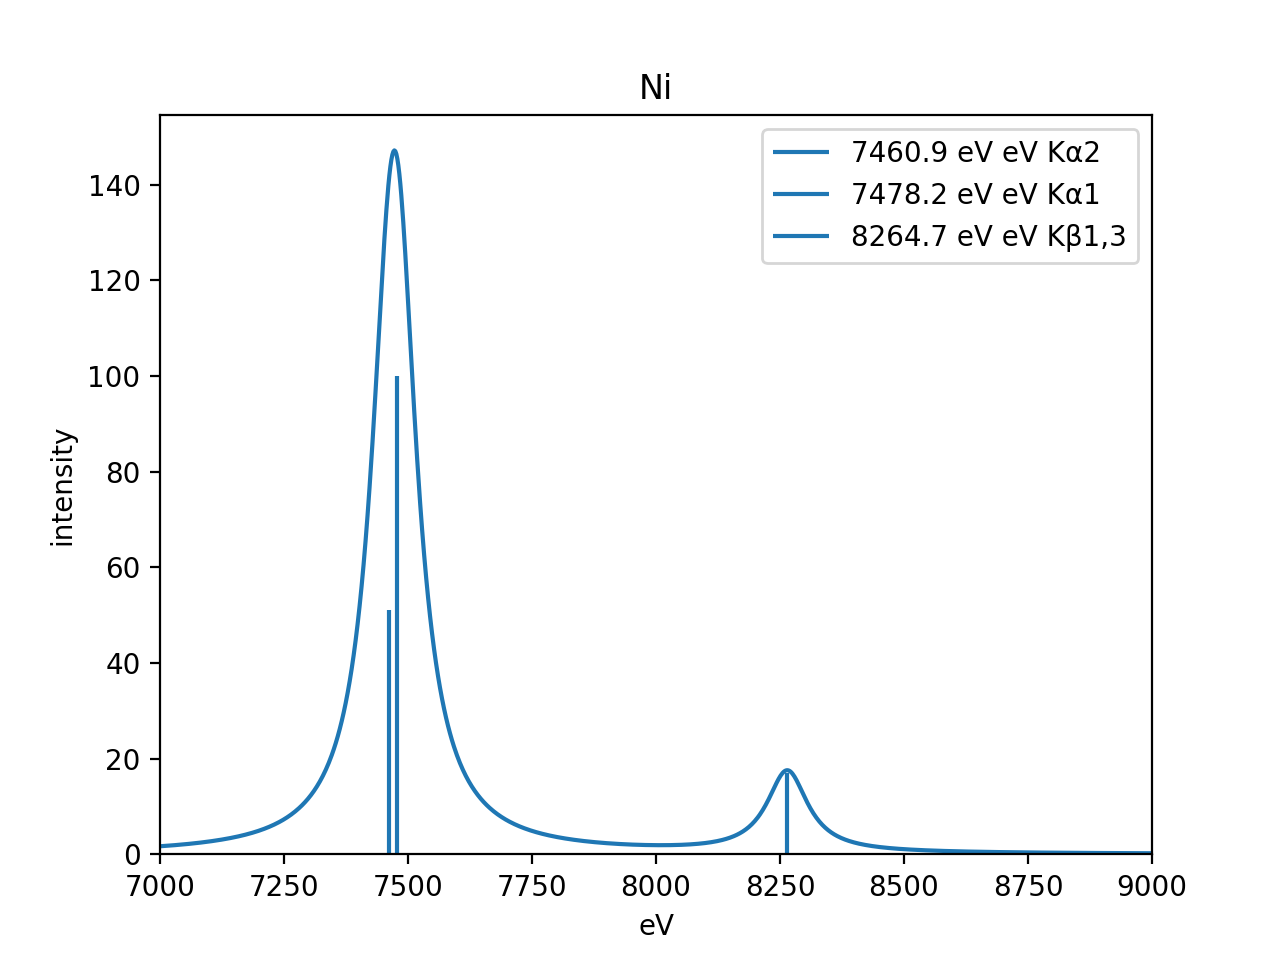
element = 'Ni'
energy_range = u.Quantity([7000, 9000], 'eV')
lines = get_lines(energy_range[0], energy_range[1], element=element)
spectrum = Lorentz1D(0, x_0=0)
for row in lines:
spectrum += Lorentz1D(amplitude=row['intensity'], x_0=row['energy'].value,
fwhm=100)
plt.title(element)
for row in lines:
plt.vlines([row['energy'].value], [0], row['intensity'],
label=f'{row["energy"]} eV {row["transition"]}')
energy_axis = np.linspace(energy_range[0].value, energy_range[1].value, 1000)
plt.plot(energy_axis, spectrum(energy_axis))
plt.xlim(energy_range[0].value, energy_range[1].value)
plt.ylim(0)
plt.ylabel('intensity')
plt.xlabel('eV')
plt.legend(loc='upper right')
plt.show()
(Source code, png, hires.png, pdf)