
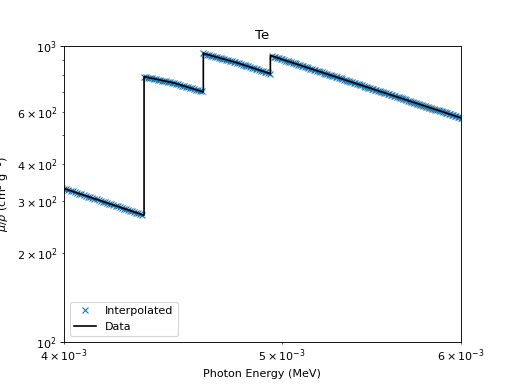
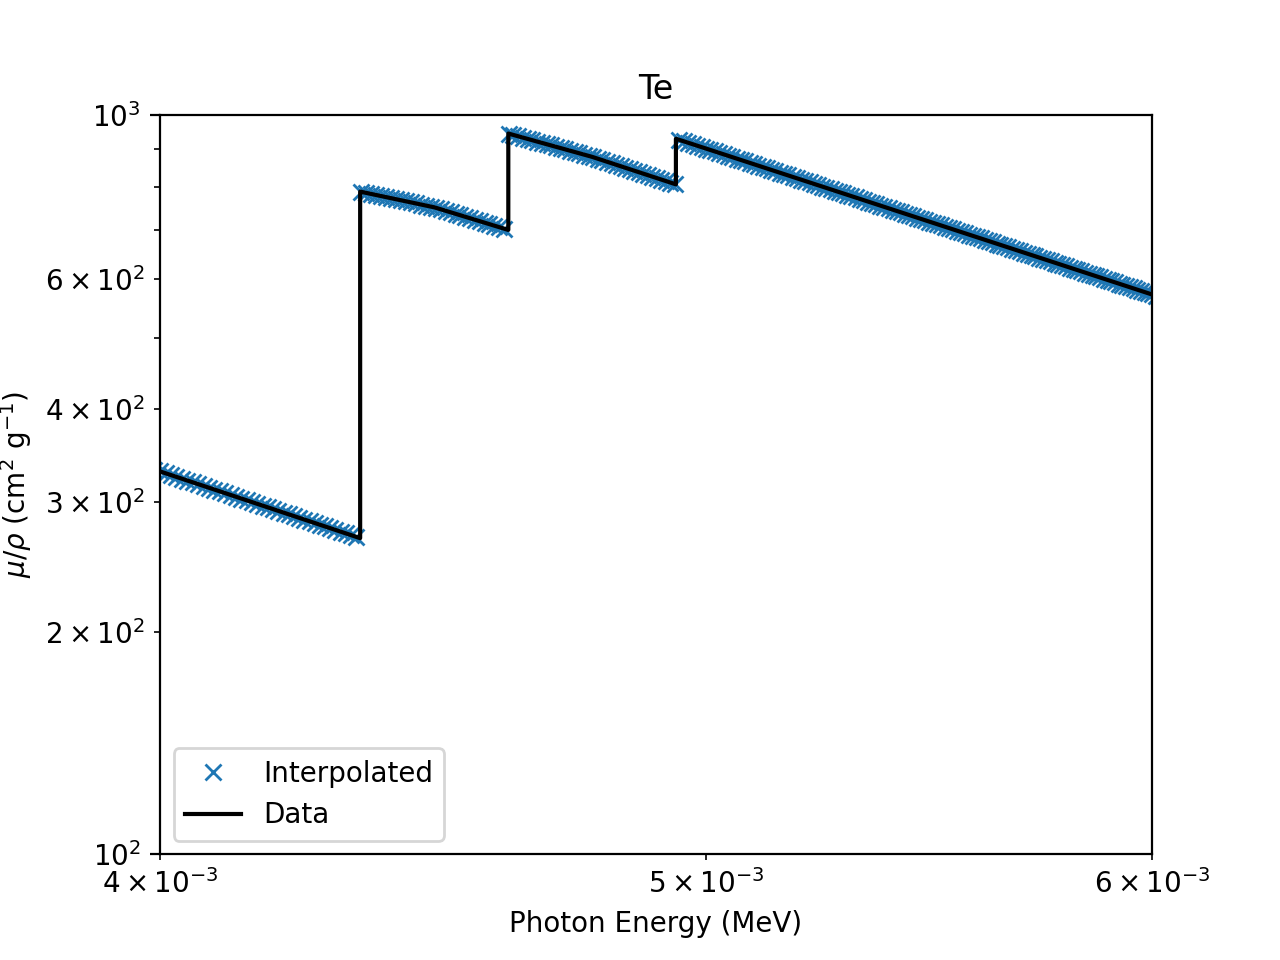
Checking on edges in the Mass Attenuation Coefficient#
import numpy as np
import matplotlib.pyplot as plt

import astropy.units as u
from astropy.visualization import quantity_support
quantity_support()
from roentgen.absorption import MassAttenuationCoefficient

e = np.linspace(1e-3, 1e-2, 1000)*u.MeV
te = MassAttenuationCoefficient('Te')
plt.plot(e, te.func(e), 'x', label='Interpolated')
plt.plot(te.energy, te.data, color='black', label='Data')
plt.loglog()
plt.xlim(4e-3, 6e-3)
plt.ylim(1e2, 1e3)
plt.xlabel('Photon Energy (MeV)')
plt.ylabel(r'$\mu / \rho$ (cm$^{2}$ g$^{-1}$)')
plt.title('Te')
plt.legend()
plt.show()
(Source code, png, hires.png, pdf)
